Overview
Queueing-tool is a Python simulation package for analyzing networks of queues. The simulations are event based, where events are comprised as arrivals and departures of agents that move from queue to queue in the network. The network is represented as a graph, which is handled by NetworkX.
There are three major components to queueing-tool: the QueueServer
classes, Agent classes, and QueueNetwork class. This package
includes several different types of each class.
The
QueueServerclass is a standard implementation of a waiting line. Its basic function is facilitating the arrival of agents — which arrive with some regularity according to some distribution — and servicing those agents before they leave. Each queue can have any arrival and service distribution, and these distributions can depend on time. Two such implemented are the following:The
QueueServerclass can have any positive number of servers (including infinitely many). There can also be a maximum number of potential arrivals to the queue. In Kendall’s notation, these are \(\text{GI}_t/\text{GI}_t/c/\infty/N/\text{FIFO}\) queues.The
LossQueueclass is an implementation of a finite capacity queue. It has all the features of theQueueServerclass but also implements blocking (or loss). This class can be used to simulate loss networks. In Kendall’s notation, these are \(\text{GI}_t/\text{GI}_t/c/c+b/N/\text{FIFO}\) queues.
An
Agentis an object that moves throughout the network. When an instance of the network is created it starts empty. Agents are created by a queue and once serviced the agent moves on to another queue in the network. Each agent decides where in the network it wants to arrive at next. Two examples of the agent implementation are:The
Agentclass routes itself throughout the network randomly. More specifically, when at nodeiin the network, theAgentdecides to transition to nodejwith probability \(p_{ij}\). The user has control over setting the transition probabilities, which can be done using the network’sset_transitions()method.The
GreedyAgentclass routes itself by choosing the queue with the shortest line.
The
QueueNetworkclass manages the routing of agents from queue to queue. It can also manage congestion and blocking within the network. There are two blocking regimes implemented:Blocking After Service: when an agent attempts to enter a
LossQueuethat is at capacity, the agent is forced to wait until an agent departs from that queue.Repetitive Service Blocking: when an agent attempts to enter a
LossQueuethat is at capacity, the agent is forced to receive another service from its current queue. This process is repeated until the agent’s desired queue is no longer at capacity.
One can also limit the maximum number of agents within the system.
This package also contains a visualization component, whereby the user can see
queueing dynamics in real-time as the simulations take place. See
animate() and draw() for more on
this package’s visualization capabilities.
An example
It’s probably best to become acquainted with queueing-tool by way of an example.
Let’s model the checkout process of a busy grocery store. People enter the store according to some random process, shop around for some time, and then checkout. They also arrive at a greater frequency in the middle of the day. When it’s time to checkout, customers choose their checkout line by searching for the shortest line. They wait in line before receiving service from the checkout counter and when they’re done they leave the store.
In queueing-tool, each person entering the system is represented as an
Agent. Each Agent decides how they navigate in the network. In
this system an Agent chooses the shortest queue to enter at whenever they
choose which queue to arrive at next. The GreedyAgent class is built
to model such routing.
The network is represented as a networkx.DiGraph. On top of
each edge in the graph sits the queues, where each queue is represented as a
QueueServer. In our model, each checkout line is it’s own QueueServer.
These checkout queues receive arrivals from people who are already in the store.
The store receives arrivals from the neighborhood, and after some time they go to
the checkout area. This is a relatively, simple network that is easy to create using
queueing-tool.
To create the network you need to specify an adjacency list (or adjacency matrix). In our toy example, we are going to assume the store has 20 checkout lines. Let’s get started:
>>> import queueing_tool as qt
>>> import numpy as np
>>> adja_list = {0: [1], 1: [k for k in range(2, 22)]}
This says that node 0 points to node one, and node 1 points to nodes 2 through
21. Now in our simple system there are three types of queues, the two important ones
are: checkout queues, and the queue that represents the store shopping area. The
third type represents agents leaving the store and is handled automatically by
queueing_tool. To specify what type of queue sits on each edge, you specify
an adjacency list like object:
>>> edge_list = {0: {1: 1}, 1: {k: 2 for k in range(2, 22)}}
This says there are two main types of queues/edges, type 1 and type 2.
All the checkout lines are of type 2 while the store queue (the edge
connecting vertex zero to vertex one) is type 1. The queue that represents
agents leaving the store are type 0 queues, and is handled automatically by
queueing-tool. Now we can make our graph:
>>> g = qt.adjacency2graph(adjacency=adja_list, edge_type=edge_list)
So we’ve created a graph where each edge/queue has a type. Since our edge of
type 1 represents the store, it will accept shoppers from outside the network.
We will take the arrival process to be time varying and random (more
specifically, we’ll let it be a non-homogeneous Poisson process), with a rate
that’s sinusoidal. To set that, run:
>>> def rate(t):
...     return 25 + 350 * np.sin(np.pi * t / 2)**2
>>> def arr_f(t):
...     return qt.poisson_random_measure(t, rate, 375)
Lastly, we need to specify the departure process for each checkout counter. Let’s choose the exponential distribution:
>>> def ser_f(t):
...     return t + np.random.exponential(0.2 / 2.1)
Now is time to put this all together to make out queueing network; we do this with the following:
>>> q_classes = {1: qt.QueueServer, 2: qt.QueueServer}
>>> q_args    = {
...     1: {
...         'arrival_f': arr_f,
...         'service_f': lambda t: t,
...         'AgentFactory': qt.GreedyAgent
...     },
...     2: {
...         'num_servers': 1,
...         'service_f': ser_f
...     }
... }
>>> qn = qt.QueueNetwork(g=g, q_classes=q_classes, q_args=q_args, seed=13)
For simplicity, we’ve made it so that when a customer enters the store they immediately try to checkout.
The default layout was a little hard on the eyes so I changed it a little:
>>> qn.g.new_vertex_property('pos')
>>> pos = {}
>>> for v in qn.g.nodes():
...     if v == 0:
...         pos[v] = [0, 0.8]
...     elif v == 1:
...         pos[v] = [0, 0.4]
...     else:
...         pos[v] = [-5. + (v - 2.0) / 2, 0]
...
>>> qn.g.set_pos(pos)
To view the model (using this layout), do the following:
>>> qn.draw(figsize=(12, 3))
<...>
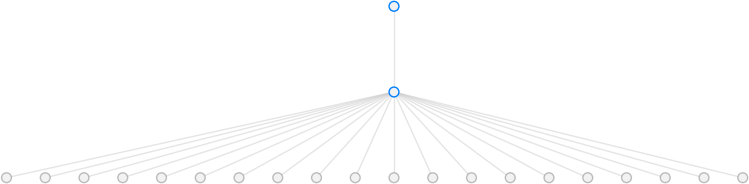
The network is empty so the edges are light. Use the following code if you want to save this image to disk:
>>> qn.draw(fname="store.png", figsize=(12, 3), bbox_inches='tight')
By default, each QueueServer starts with no arrivals from outside the
network and it needs to be initialized before any simulations can run. You can
specify which queues allow arrivals from outside the system with
QueueNetwork's initialize() function.
In this example, we only want agents arriving from the type 1 edge so we do the
following:
>>> qn.initialize(edge_type=1)
To simulate for a specified amount of simulation time run:
>>> qn.simulate(t=1.9)
>>> qn.num_events
1167
>>> qn.draw(fname="sim.png", figsize=(12, 3), bbox_inches='tight')
<...>
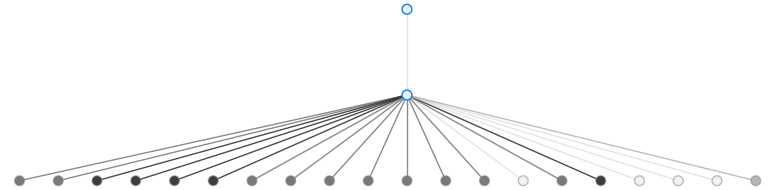
The darker edges represent greater congestion at that checkout counter.
If you want to save the arrival, departure, and service start times of arrivals you have to tell it to do so:
>>> qn.start_collecting_data()
>>> qn.simulate(t=1.8)
>>> data = qn.get_queue_data()
>>> data.shape
(2261, 6)
The above data also include the number of agent in the queue upon arrival to a
queue (this includes the number of agents receiving service and the number of
agents waiting). If we only care about data concerning those exiting the system
we can specify that by having type 0 edges collect data:
>>> qn.clear_data()
>>> qn.start_collecting_data(edge_type=0)
>>> qn.simulate(t=3)
>>> data = qn.get_queue_data(edge_type=0)
>>> data.shape
(575, 6)
The above code collected the departure times of every agent over the simulated
period, it did not collect each agent’s arrival or waiting time. See
get_queue_data() and start_collecting_data() for more on extracting data.